Returns to Four-Year Higher Education
Key Findings
- Key Finding 1
The financial return to earning a postsecondary degree is very large for the average student.
Today’s typical college graduate could expect to earn over $1 million more than the typical high-school graduate over the course of her career. These are large returns that easily justify direct costs of attending college, such as tuition and fees, as well as the indirect cost of foregone earnings from spending time in school rather than work. Even for students who might have been on the fence about whether to go to college or enter the workforce immediately after high school, research identifies large returns on investing in a college education.
- Key Finding 2
Despite the large average return, there is a significant risk that college will not be worth the financial investment.
Many students will not recoup their monetary and time investment in college. Even more will not do so until late in life, or to the degree that they expected when they enrolled. The reasons for this are explained under Key Finding #3.
- Key Finding 3
The returns to college differ widely across student backgrounds, college majors, and types of colleges.
The difference between top- and bottom-earning majors is particularly large at more than $2 million.
- Key Finding 4
The single greatest risk-factor for college not “paying off” is failure to graduate.
Arguably, the worst position for an individual to be in financially is to have borrowed but failed to complete her degree. The earnings of the typical high-school graduate are not sufficient to comfortably repay even small amounts of student loan debt.
- Key Finding 5
Students are increasingly seeking graduate degrees or certificates/short-term credentials from four-year colleges and universities.
These involve very different degrees of investment in terms of time and expense, and both are relatively understudied compared with bachelor’s degrees.
Introduction
The question “Is college worth it?” is among the most discussed and debated policy topics. High levels of both tuition and student debt make this a central question for policymakers and families planning for the future. Fortunately, social scientists have devoted a commensurate amount of time and effort to studying the returns to higher education from many different angles. We distill much of the vast research on returns to higher education in this chapter, focusing primarily on what we know about the effect of earning a four-year bachelor’s degree on individual earnings in the U.S.1 We extend earlier reviews of the considerable body of research on this question2 to include newer work and then illustrate the estimated income premium from college using the latest available data. The picture that emerges is more nuanced than is often presented in the popular press.
On the one hand, the financial return for the average student is considerable and passes any reasonable cost-benefit calculation. Economists typically estimate the financial “return” to education as the lifetime earnings gain from attendance, also referred to as the “college premium” or the increase in earnings relative to those who do not attend. Research routinely finds that this return is more than enough to cover the cost of college—both direct expenditures such as tuition and the indirect cost of time out of the workforce—and thereby nets a positive return on investment. Our updated estimates discussed in this chapter suggest that the median college graduate in 2023 might expect to earn $1.3 million more than the median high-school graduate.Despite this (unusual for social science) unambiguous finding, the story is much more complex when considering the full range of returns to higher education, not just the average. Attending college likely makes a nontrivial number of students worse off financially. This risk is associated with many factors, some in a student’s control and some not.
The degree that a student pursues is important in assessing postsecondary risks and returns, both because of differences in the standalone value of credentials from each level and the option value of complementary, follow-on degrees. For example, obtaining a four-year degree opens up the possibility of attending graduate school, which can substantially increase earnings over a career. The institution that a student attends and the major that she chooses are also relevant for the return on investing in a postsecondary education, as is student background.
However, the single largest determinant of whether college will “pay off” for a student is whether she graduates with a degree. Students who start but do not complete college tend to earn more than they would have with a high-school diploma, but on average, the income premium will likely not make up for the costs of attending college. Approximately four in ten students attending four-year institutions do not graduate.
The chapter concludes by highlighting three emerging trends in higher education where more research is needed. First, more students have been opting to attend graduate school, where we have less data on program costs and outcomes and both the risks and rewards may be much larger. Second, on the other side of the spectrum, there has been a recent rise in short-term credentials in the four-year sector, often based on training in specific skills and for specific occupations. The third trend is the ongoing march of technology, which affects the provision of a college education (through online learning, for example) as well as the value of particular skillsets in the labor market (such as those that complement or compete with artificial intelligence). More research is need in all three of these areas.
Evidence
Key finding #1: The financial return to earning a postsecondary degree is very large for the average student.
With more than 15 million undergraduate students enrolled in the US.3 and billions of dollars spent subsidizing both students and institutions, the return on investment from a college education is a critically important question for both government policy and family planning.
Before addressing the literature on the returns to higher education, it is useful to start out with some basic descriptive facts. Individuals with a bachelor’s, professional, or doctoral degree have both a higher wage and a lower likelihood of unemployment than those with only a high-school education (Figures 1–2). The median weekly pay with a bachelor’s degree is $1,493, which translates to $37.33 per hour for a 40-hour workweek. This is well above the “living wage” that would cover a full-time worker’s basic needs (approximately $20–30 per hour for a single adult with no children).4 However, the typical worker with only a high-school diploma earns $22.48 per hour, which is at the low end of the living wage standard. These figures are by no means proof of whether higher education is worth the investment, but they are a useful starting point. We need to adjust these figures in three ways to get closer to the question of whether college will pay off for the typical student today.
Footnotes Notes: Data are for persons aged 25 and over. Earnings are for full-time wage and salary workers. Source: Bureau of Labor Statistics, Current Population Survey (2023).
Median weekly earnings by education level

First, note that Table 1 statistics cover all U.S. persons aged 25 and up, but the earnings of late-career individuals might distort what a younger person could expect to earn shortly after leaving school. Indeed, among younger individuals, the income gap is narrower between workers with and without a college education5 but nonetheless remains large. Median earnings were $60,000 annually ($1,200 per week) for recent college graduates in 2023 versus $36,000 annually ($720 per week) for recent high-school graduates.6
Footnotes Notes: Data are for persons aged 25 and over. Earnings are for full-time wage and salary workers. Source: Bureau of Labor Statistics, Current Population Survey (2023).
Unemployment rate by education level

Second, the college premium in terms of weekly or annual earnings might be of less interest to those who view college as a path to an entirely different trajectory of jobs and income over a lifetime. We can offer informed speculation about lifetime earnings with and without college if we apply stringent assumptions about how the labor market will evolve over time, how an individual’s earnings will grow over her career, and whether today’s 55-year-olds give us an approximate picture of what today’s 20-year-olds can expect when they reach age 55. Typical practice assumes that historical trends for each age and level of education will persist in the future, which conflates age with cohort effects and embeds stability into labor market trends that likely does not exist. However, the substantial benefit of this approach is that the findings are more easily translated to policymakers and the public. The typical study7 using this approach finds a lifetime earnings premium of well over $1 million (in 2024 dollars) for a bachelor’s degree, with larger average benefits for master’s, professional, or doctoral degrees. Accounting for the costs of enrolling, including tuition, fees, and foregone earnings, the additional stream of income from a bachelor’s degree is equivalent to a 12–15% return on investment.
Despite the strong assumptions that go into these forecasts of lifetime earnings, a 12–15% return is not very different from the quasi-experimental estimates reviewed below. In addition, 12–15% far exceeds what one could expect to earn from other financial investments. Over the long term, the inflation-adjusted return on stocks has been approximately 7% annually. Thus, a short answer to the question, “Is college worth it?” is a confident “yes, on average” since higher lifetime earnings dominate the upfront direct and indirect costs.
The third and central challenge with estimating the financial returns to higher education, however, is that who attends or graduates from college is not random. The application process explicitly selects students who excel academically, which is predictive of future labor market success with or without college. Students who excel in grades K–12 tend to come from more advantaged family backgrounds, which is also predictive of better outcomes after schooling. It is thus reasonable to ask the question, does college “cause” higher earnings and employment, or is it simply correlated with better outcomes?
Fortunately, given the right data and institutional conditions, there are statistical methods built to isolate causal returns. Researchers have approached this question with a wide array8 of causal methodologies, almost uniformly finding large positive returns. Table 1 highlights several well-known studies along with a sketch of their methodology and key results. The findings are generally representative of the larger body of research, with causal returns to higher education varying between 8% and 18% per year depending on the population and methodology.
In addition to providing credible causal evidence on the return to college, quasi-experimental findings such as those listed in Table 1 offer another advantage over descriptive earnings gaps such as those inferred from Figure 1. Descriptive methods show that there is a large average gain in income with a college education, which is often used to justify college investment. However, even if the returns to higher education are large for the average college graduate, is this fact actually useful to families and policymakers? If the question is about expanding access to college or about whether an individual with weaker academic ability should pursue a bachelor’s degree, the income premium for the marginal, rather than the average, student is key. If access to higher education is expanded, the relevant population is the new students who would not have enrolled in the absence of opportunities to do so. It is entirely possible that the returns to college could be large for the average student but negligible for the student who is barely accepted into college.
For each of the studies listed in Table 1, the estimated return to college comes from quasi-experimental settings where some individuals did not go to college, went to a better or more selective college, or stayed in college for reasons that were arguably as good as random. This approach identifies the effect of different aspects of higher education for students at the edge (that is, at the margin) of those exact decisions. Note that Table 1 covers research published over a 30-year period and describes students who attended college from the 1970s through 2000s. Strong positive returns to higher education is one of the more consistent findings in the field.
Some of these studies rely on arguably random variation in how close students live to colleges. The thought experiment is that, all else equal, those who grew up near a college or university are more likely to attend college for reasons that are unrelated to unobserved differences in student demand for or interest in college. Economists have applied this thought experiment in instrumental variables analysis to approximate the findings from randomized control trials. For example, David Card showed in a 1995 paper that young men who grew up near a four-year college tended to have more years of schooling, controlling for family background, region of the U.S., and individual IQ. The effect of proximity to higher education appeared to be stronger for young men whose parents had not gone to college, i.e., more marginal students. For individuals who attended college because of that proximity, Card’s instrumental variable estimates suggest that their hourly wage increased 10–13% per year of additional schooling.9
A recent analysis from Texas used proximity-based instruments to estimate returns to higher education at two different margins: enrolling in a two-year school versus not attending college or enrolling in a four-year school rather than a two-year school. Texans who went to college because of nearby access to a community college had 18% greater quarterly earnings in their late 20s, or 10% per additional year of schooling. Those who went to a nearby two-year school rather than a four-year school had imprecisely lower quarterly earnings, by 10% on average or 16% per foregone year of college. These findings echo an earlier study from 1993, which documented similar returns to two-year versus four-year college credits for students whose enrollment choices were determined by distance.
Distance to college is not the only margin that might quasi-experimentally affect college enrollment decisions. Other studies have focused on other margins, such as admissions criteria. For example, one study quantified returns to college for the marginal student by studying a large public university where GPA and test score cutoffs partially determined admission. Students with nearly identical admission profiles, but falling on either side of the threshold, had very different postsecondary experiences. Since this was a less selective institution, many students who fell below the admission threshold likely attended a community college or did not attend college at all. The study quantified financial returns to attending college for the marginal four-year student by comparing the pay outcomes of students who barely exceeded the admission threshold with pay for students who just fell short of the threshold, The financial benefits from barely passing the threshold were 22% higher earnings 8–14 years after completing high school, more than enough to compensate for the explicit (tuition) costs of college as well as the implicit cost of foregone earnings (time outside the labor force).
Other studies of admission thresholds in different settings have found similarly large returns for students on the margin between more- and less-selective colleges,10 including students who are likely choosing between a four-year university and community college. We might come to very different conclusions about the returns to a four-year education over a counterfactual two-year education if we focused solely on studies of admission thresholds, where estimated returns have been very large, versus proximity-based instruments, where returns have been more similar. These differences do not mean that one method or the other is right or wrong, however, since they estimate returns from different levers into college. Perhaps part of the return to higher education comes from capacity-constrained four-year schools. Not everyone who applies is admitted, and students who just barely gain access to more selective institutions move to a significantly higher earnings trajectory. The credibility and testable assumptions of the research utilizing these thresholds gives us a high degree of confidence in the estimated benefits. However, they apply to a narrow set of students near the admissions thresholds and not necessarily to admitted students well above the threshold, whose college attendance is due to different levers (including, perhaps, proximity to college growing up). It is often assumed that the causal gains for marginal students are lower than those for nonmarginal students, but this is difficult to rigorously test given research design limitations.
Footnotes Full citations are in endnotes. See Card (2001) for additional details on Kane and Rouse (1993), Card (1995), Lemieux and Card (2001), and others in the first wave of quasi-experimental analyses of the returns to education. See Oreopoulos and Petronijevik (2013) for additional details on Hoekstra (2009), Angrist and Chen (2011), and Zimmerman (2014), among others, in addition to discussion of the evidence for the effect of education on non-financial outcomes.
Quasi-experimental evidence on the labor market returns to higher education
Study Outcome Data Endogenous Variable Quasi-experimental treatment Estimated returns per year Kane and Rouse (1993) Log annual earnings, age 24-32 (6-14 years after high school) NLS-72 and 1979 NLSY Years of college (total credits / 30) Instrumental variables: in-state tuition, home proximity to college, parental education 8.0 – 11.6% Card (1995) Log hourly earnings in 1976, age 24-34 NLS Young Men (1966 cohort) Years of completed education Instrumental variables: home proximity to a 4-year college, with or without parental background interactions 9.7 – 13.2% Lemieux and Card (2001) Log annual income, age 25-65 1971 Canadian Census, limited to men Years of schooling Instrumental variables: indicator for Ontario-born men age 19-22 in 1946, who had high rates of military service 14.1 – 17.5% Hoekstra (2009) Log annual earnings, age 28-33 White male applicants to a state flagship university Flagship university admission Discontinuous admission likelihood at cohort and GPA-specific SAT thresholds 18.1 – 28.1% Angrist and Chen (2011) Log weekly wages, age 48-52 White males in the long form sample of the 2000 Census Years of college Instrumental variables: draft eligibility by birth cohort and draft lottery number 7.6 – 8.9% Zimmerman (2014) Average quarterly earnings, age 26-32 Florida high school graduates, classes of 1996-2002 Admission to four-year university Discontinuous likelihood of admission to Florida International University at GPA threshold 22% Ost et al. (2018) Log weekly earnings, 7-12 years after starting college Ohio public university students, 2000 - 2010 Postsecondary persistence Discontinuous likelihood of dismissal for students with GPA falling below a threshold 4.5 – 6.6% decline relative to persisting students Mountjoy (2022) Quarterly earnings, age 28-30 Texas public high school students, classes of 2000-2004 Two-year or four-year college enrollment Distance between high school and nearest two-year and four-year colleges 18% return to two-year enrollment over no college; imprecise -10% lower earnings from two-year enrollment over four-year enrollment Goodman, Hurwitz, and Smith (forthcoming) Estimated household income, age 27-31 SAT test-takers in Georgia, class of 2004-2008 Admission to four-year university Discontinuous likelihood of admission at SAT thresholds 18.3%
Key finding #2: Despite the large average return, there is a significant risk that college will not be worth the financial investment.
It may seem counterintuitive, given the evidence from Key finding #1, to argue that attending college should be framed as a risky financial proposition. However, a student might take many different pathways through college, all leading to a wide variety of labor market outcomes. This variation is more than enough to generate negative returns for some students, large average returns exceeding $1.0 million, as well as even greater returns for students in high-paying fields.
The next few sections present new estimates of the overall level of risk and the main factors responsible for the downside risk of going to college.12These findings use the same methodology as a 2016 piece by one of this chapter’s authors but with data from 2023 and onward. This is an important feature, as the labor market for noncollege workers saw large gains13 over the course of the pandemic recovery, and thus pre-pandemic data might not reflect the value of a college degree today.
As a starting point, the median college graduate in 2023 might expect to earn $1.3 million more than the median high-school graduate. This figure takes the income difference between recent college and high-school graduates in the 2023 American Community Survey, carries expected earnings for both groups forward in time based on typical age-earnings profiles we see in the National Longitudinal Surveys of Youth, and finally, discounts the income streams into 2024 dollars.14'15 This is not the estimated causal effect of higher education on expected earnings that we might obtain from a quasi-experimental context, but it is a good starting point generated from the most recent labor market data. The major advantage to this more descriptive approach is that the scale of the American Community Survey (which is collected from approximately 3.5 million U.S. addresses each year) allows us to study the full range of the college income premium across many different settings, college pathways, and for specific populations of individuals with different backgrounds.
Furthermore, we can apply corrections to the baseline $1.3 million estimate of individual returns to college to account for nonrandomness in who attends and completes college as well as the fact that the U.S. has a progressive income tax.16 In terms of the explicit costs of attending college, we assume that students pay the average cost of attendance at a four-year public school ($20,780),17 take five years to graduate, and leave school with $30,000 in student loan debt (roughly the average for borrowers18) that is repaid via the most recent income-driven repayment plan. Under those conditions and assuming a 3% time-value discount, the typical after-tax, present-discounted lifetime benefit of a college degree is roughly $243,000. This figure only applies to college graduates who never attend graduate school and thus may understate the benefit of a bachelor's degree depending on the costs of graduate education, additional time in school, and additional returns to the graduate program attended.
However, even modest variation in individual returns/costs can lead to college being a net negative financial proposition for some students. Based on the above simulation, roughly 26% of college graduates are predicted to earn less than the median high-school graduate. However, the high-school earnings threshold should be considered a very low bar and is likely not what most students or policymakers have in mind when thinking of the lifetime value of a college education.
There are additional benefits of college the reader should keep in mind when considering these results. The figures represent the returns for individuals, not households or society. A college-educated individual is very likely to have a college-educated spouse. So, from the perspective of household finances, the high prevalence of matching by education19 can increase the financial returns to a college degree. Furthermore, since high-paying jobs tend to be more desirable along many dimensions (both in terms of employment benefits such as health insurance and retirement and nonpecuniary benefits such as job satisfaction), there are good reasons to view the returns presented above/in the literature as a lower bound for the true boost to well-being that a college degree can impart. Finally, individual returns to college obscure spillover and societal benefits, including higher wages for workers without college.20
The above evidence paints a much more nuanced picture of the financial returns to higher education than is typically seen in policy discussions, and part of this nuance requires the reader to keep in mind the relevant alternative to college.21 Strictly in the sense of financial well-being, the clear majority of college graduates are substantially better off over the course of a lifetime than those without a college degree. From this perspective, a college degree has such a large and likely premium over a lifetime that any public subsidies targeted at this group would be regressive. However, that large premium is not guaranteed, and some students realize much more or less than the average. Factors that determine the individual return to college, most notably the risk of not completing a degree, further complicate any discussion of the investment in college.
Key finding #3: The returns to college differ widely across students, driven in part by factors such as student and family background, college major, and type of institution.
While it is clear that the range of financial outcomes for college graduates is quite large, a natural question is the extent to which these outcomes under the control of students. In particular, does it matter where you go to college, and what you choose to study?
The same causation versus correlation concerns that complicate estimated returns to college are present when discussing the returns to individual institutions or majors. Students do not choose schools or majors at random, and neither do admissions offices choose students at random.
Student and family background
Demographics and family background are beyond a student’s control, so it is unfortunate that they play a significant role in the risk associated with attending college. In addition to the effect of gender, race, ethnicity, and family background on the institution attended and the likelihood of completion, even the baseline $1.3 million lifetime earnings premium is related to race and gender. Using the methodology introduced in Key finding #1, the premium for white graduates ($1.38 million) far exceeds that of Black graduates ($1.0 million), as does the premium for male graduates ($1.56 million) relative to female graduates ($0.99 million).
College major
There are large differences in the lifetime returns to different majors, with a roughly $2 million difference between top-earning majors such as engineering or economics and bottom-earning majors including fine arts or graphic design.22 Research indicates that these are causal differences to some extent, not solely a product of bias from high-ability students enrolling in high-paying programs.23 See for a deeper discussion on the individual returns to different majors and factors affecting institutional supply of different majors.
The policy conversation around how many and which students should pursue certain majors can sometimes lack important nuance. It is often presented as obvious that more students should major in fields with a high average financial return. Even ignoring the components of job and life satisfaction not related to income, this advice may be frequently wrong. Comparative advantage likely matters and should be considered when choosing a major. For example, the average accounting major makes more over her lifetime than the average English major. However, the counterfactual for the average English major if she switched to accounting is unlikely to be the average in their new major. Consider instead an above-average but not top-of-the-class English major (75th percentile). Imagine that if she instead majored in accounting, she would be below average but far from bottom-of-the-class (25th percentile). In this scenario, majoring in English might be the income-maximizing choice for the student. The very difficult problem here is that we lack a good counterfactual for a given student because it could differ for each pairwise comparison of majors. Making progress on this problem would be very useful for both the policy and research communities in the coming years.
Types of colleges
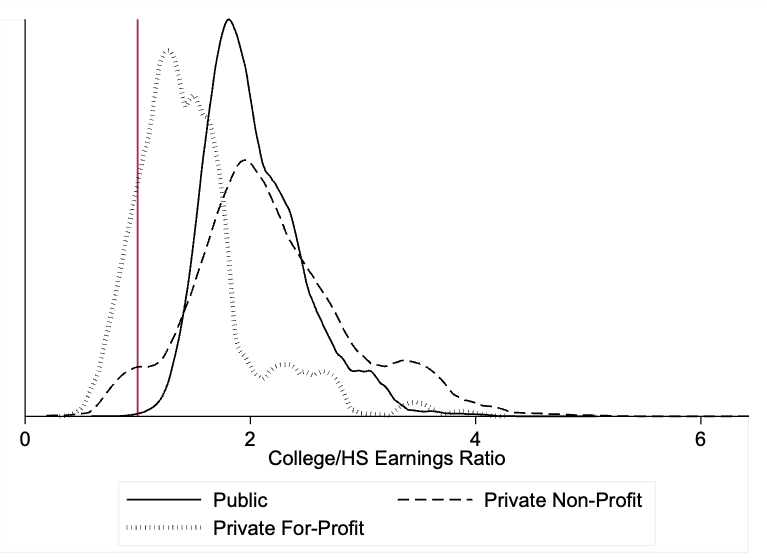
There is a long research literature on whether the institution you attend has a causal impact on future earnings. Before discussing the causal evidence, it is worthwhile to start with the raw differences in earnings outcomes across schools. Figure 3 uses College Scorecard data from the U.S. Treasury and U.S. Department of Education to plot cost-adjusted earnings ratios for the median student at every four-year college and university in the U.S. The horizontal axis measures the ratio of earnings for the median student 10 years after first enrollment relative to the national median high-school graduate. Earnings are adjusted for each school based on the net cost of attendance by assuming that the entire cost of a degree (e.g., four years of attendance) is financed by student loans and repaid via the 10-year standard repayment option.24 The vertical red line indicates where earnings (netting out the cost of attendance) are identical for the median student at a particular school and the median high-school graduate, a kind of “break-even” point.
There are several important takeaways from this figure. First, public colleges and universities offer an education with far less downside risk than other sectors, due primarily to their relatively low prices. Second, the private nonprofit sector has more schools with both very good and very bad outcomes relative to public schools. Private nonprofit schools, including schools with very poor labor market outcomes, tend to have high price tags, accounting for the left tail of the distribution. Finally, for-profit schools have, on average, worse outcomes than other sectors, but there are some schools in this sector with good outcomes (a few even better than most nonprofit institutions).
This figure underscores the difficulty in crafting federal accountability programs that focus on types of colleges, a task made even harder when considering the variability in outcomes across different programs.25 One sector is not responsible for all the bad labor market outcomes. As far more students are enrolled in the nonprofit sector, meaning that even a small proportion of schools with bad outcomes will represent a large number of students, policies seeking to provide consumer protection should apply to the entire higher education ecosystem.
- Figure 3
Median earnings after college, by institutional sector
Footnotes
Notes: The figure plots the distribution of institution-level median earnings, derived from the College Scorecard, divided by the median earnings of high-school graduates. Distributions are presented separately by institutional control and weighted by student enrollment. Institution-level earnings are adjusted for the average net cost of attendance.

There is a growing literature on the role26 that the for-profit sector plays in the current higher education landscape and the individual returns to for-profit college attendance, as well as attempts to address statistical bias that could be present in examining only raw labor market outcomes such as the above figure. The literature27 generally finds large differences in outcomes between sectors using a variety28 of approaches, with the returns to for-profit attendance lagging significantly behind that of other sectors.29
There is a longer literature on the differences in outcomes across different groups of institutions along dimensions other than for-profit status. Early research designs evaluated the return to attending higher quality colleges from differences in post-schooling income across schools with different rankings, per-student expenditure, average SAT, and so forth, controlling for observable characteristics of the schools and students.30 The richest models along these lines additionally control for the selectivity of institutions where students applied (proxied by average SAT scores), netting out unobservable factors and tastes that lead students to favor more- or less-selective schools.31 Adding these controls substantially reduces or eliminates the estimated return to attending higher quality colleges, although large income premia remain for Black students, Hispanic students, and students whose parents had fewer years of their own schooling. For example, 18 years after starting college, a student whose parents had a high-school education earned 5.2% more by attending a college with a 200-point-higher average SAT. For students with college-educated parents, however, there was no discernible return to attending a higher-SAT school.
The return on attending a more selective/higher-resourced college is an unsettled research question. Recent work applies convincing causal designs such as regression discontinuity32 based on admissions thresholds and using detailed administrative data on students’ later earnings (see the discussion of Key finding #1 around Table 1).33 The general pattern of results across many papers indicates that there are large causal differences in the labor market returns to attending different colleges. For example, gaining access34 to the public university system in the state of Georgia increases income by 17%, a return that pays for the investment within 10 years of first enrolling. The likely alternative for these students would have been community college, suggesting that there is a relatively higher payoff to four-year enrollment.
A reasonable summary of research on the returns to higher education is that the choice of college major and institution both matter for future labor market outcomes but that the choice of major matters more than the choice of institution.35This can be an important point for families to consider, as they can frequently find themselves considering dramatically different tuition bills and financial aid packages from schools with similar major offerings.
Key finding #4: The single greatest risk-factor for college not “paying off” is failure to graduate.
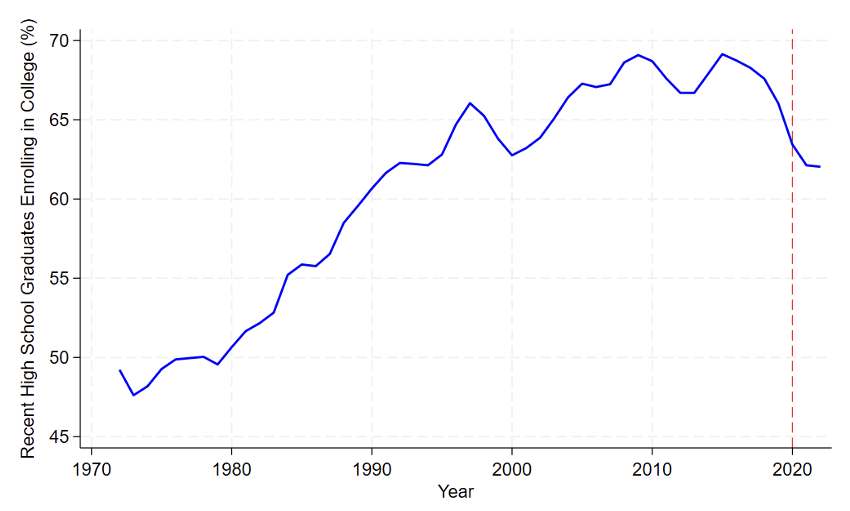
The college earnings premium is frequently presented as de facto proof that attending college is worth the investment. Indeed, the above empirical evidence seems to make that case in a rigorous way. However, the major disconnect is that only college graduates receive the full premium. The graduation rate at four-year institutions is roughly 60%,36varying substantially across schools, and has only risen marginally despite decades of effort and investment. The truth is likely that higher education has made more progress than the raw statistics indicate, since colleges have dramatically expanded access over this period, enrolling students who often need more support to graduate. Figure 4 shows that college-going has steadily increased for new high-school graduates over the last 50 years, from 49% in 1972 to 62% in 2022. That caveat notwithstanding, a 60% graduation rate is far below what most would consider adequate, especially since researchers attribute part of the observed gains in college graduation rates to grade inflation.37
- Figure 4
College-going rates, 1972–2022
Footnotes
Notes: College-going rates are from Table 302.10 of the Digest of Education Statistics (NCES, 2023). The year 2020 is highlighted, when many institutions adopted temporary test-option admissions policies.

Given the large proportion of students who attend college but do not complete their degree, a natural question is whether the return to attending college without a degree (sometimes referred to as “some college”) exceeds38 the implicit and explicit costs of attendance. This question is related to longstanding, but difficult39 to resolve, literature on human capital and labor market signaling, as well as the degree to which the college premium displays a “sheepskin” effect. Workers who complete a degree may have an advantage in employment, earnings, and promotions relative to others who took the same number of courses but did not graduate. This advantage may come through minimum education requirements for higher-paying jobs or how employers value resumes with college credits but no degree. In other words, what proportion of the wage gains to college are unlocked only when a student graduates, rather than incrementally as credits are accumulated? While there is disagreement40 on the exact proportions, large sheepskin effects41are generally found in the literature, meaning that paying (and borrowing) for one year of college will yield far less than one-fourth of the college premium. The large role of noncompletion on future labor market outcomes has been shown both explicitly and implicitly, the latter through loan repayment rates.42
If we perform the same sort of life-cycle earnings projections as in Key finding #1 for the “some college” population rather than college graduates, the financial risks associated with noncompletion become clear. The median lifetime premium from “some college” is estimated to be $260,000 (compared to $1.3 million for the median college graduate). Accounting for taxes and present-value discounting, the premium is only $17,000 ($243,000 for the median college graduate). Finally, only 48% of individuals in the “some college” category would earn more in discounted after-tax dollars than the median high-school graduate. In other words, there is effectively no meaningful financial return to the median student in the “some college” category once one considers both the implicit/explicit costs of attending college and the time horizon over which those costs are recouped.
Noncompletion plays such a large role in financial well-being43 in part because of how much the cost of attending college has risen over time. If attending college were free or relatively cheap, noncompleters would only lag never-attenders by the value of the time spent out of the labor market while attending school, which is small compared to overall lifetime earnings. However, as tuition and related costs have risen, so too has the financial risk from not graduating.
Institutional factors also undoubtedly play a role in the downside risk of attending college. For instance, unlike most consumer loan products, student loans have legal restrictions related to the ability to discharge in bankruptcy, making loan repayment particularly problematic for noncompleters.
These institutional factors increase the downside risk of college most for students from low-income backgrounds, particularly Black borrowers.44 This is especially true in the case of noncompletion, where stark differences exist across race/ethnicity. For example, only 40% of Black students graduate within 6 years compared to 64% of white students.
Overall, even given the risk of noncompletion, college remains a financial investment that is likelier than not to pay off (see Key finding #).45 However, the downside risk is much larger than many realize and not equally distributed across students.
Key finding #5: Students are increasingly seeking graduate degrees or certificates/short-term credentials from four-year colleges and universities.
Given the large literature examining the returns to bachelor’s degrees, the research and policy frontier in education lies elsewhere. Two emerging areas with significant interest but limited research are on the labor market returns to short-term credentials (including certificates, certifications, licenses, and firm-specific credentials) and graduate school. Both topics are more difficult to study than traditional two- or four-year degrees due to data limitations and heightened concerns about nonrandom selection.
The proportion of the working-age population with a graduate degree is 15%, and among those who have at least a bachelor’s degree, 37% also have a graduate degree.46 Both figures have been increasing over time given a higher tendency among young adults to enroll in graduate school. The decision of whether to attend graduate school amplifies both the upside and downside risks generally associated with higher education. The costs are higher, as most graduate programs do not provide the same amount of financial aid that is available to undergraduate students, and graduate loans have less favorable terms. Federal loans for graduate programs charge higher fees and higher interest rates than loans for undergraduate programs, and graduate borrowers are not eligible for need-based subsidized loans.
The potential benefits of a graduate degree can be very large, including access to some of the highest paying jobs in the U.S. economy. However, the range of outcomes with a graduate degree is very wide, and research on the effect of a graduate education on earnings finds substantial differences in estimated returns across programs.47
On the other end of the higher education spectrum, there has been a proliferation of both policy interest and enrollment in nondegree credentials. These programs range in length from several weeks to two years and are often marketed as providing skills that are tightly tied to specific jobs or even specific employers.
Most research in this area has focused on certificates offered by two-year technical and community colleges. Recent research in this vein from Kentucky focuses on very short-term credentials, including some that can be earned with as little as 6 credits, or roughly two classes.48 In that setting, rapid certificates signifying 1–6 credits had similar short-term returns as longer-term, 7–36 credit certificates, although the premium from a rapid certificate appeared to fade quicker.
Overall and field-specific returns to certificates have been studied at length, but the extent of heterogeneity in program quality in the certificate-granting sector is unclear49 relative to that of two- and four-year degrees (particularly by for-profit status). To our knowledge, there are no studies on the returns to short-term stackable credentials that are increasingly embedded within four-year degree programs.50 Short-term credentials in the four-year college sector are one way to address stagnating degree completion—giving students credentials for meeting intermediate benchmarks—and for degree completers, they signal skillsets that are more specific than majors and minors. The extent to which short-term four-year credentials command a premium in the labor market is unclear, however, and research designs that have been used to study mid-career college students would not work well for traditional-aged students who moved into college shortly after high school.
Conclusion
Several decades of research have helped to shape our understanding of the returns to higher education. A consistent takeaway from that body of scholarship is that the returns to college are high on average and substantially exceed the cost of college. Although the return on investment in college is very favorable for the average student, income premia and costs vary widely across individuals, programs, majors, and institutions. Researchers have traced the sources of that variance and the downside risk of attending college back to student background factors, choice of program and field, and perhaps most important, whether a student completes a degree. The potential returns to higher education now include gains from programs, pathways, and credentials that differentiate from traditional degrees. Future research in this area can help guide policy and practice on the value of expanding the set of credentials that students can earn from colleges and universities.
Another topic that we expect to be the subject of future research is the influence of emerging technology on the returns to higher education and the job opportunities that students have with and without a college education. For some jobs, artificial intelligence (AI) and automation might substitute for what would have otherwise been college-educated workers. Weaker hiring rates for new college graduates in 2025 are consistent with this idea,51 although it is too soon to isolate the role of AI technology. Education has been in competition with technology in the U.S. for over a century, and economists credit education with winning the “race” against technology for most of the 20th century.52 Since then, however, the balance may have shifted as automation and AI reliably complete some tasks that were previously completed by workers. Future research will clarify where and how newer technologies complement a college education, raising the earnings premium beyond what we see today, as well as the circumstances where technology substitutes for college-educated labor and thus cuts into the return to a four-year college education.
Endnotes and references
-
Our focus on the individual returns to a four-year post-secondary return omits two related areas of research: nonfinancial effects of college attendance, including broader, societal effects of higher education that go beyond individual earnings, and the effect of attending a two-year community or technical college. On nonfinancial and societal returns, see Moretti, Enrico. Estimating the Social Return to Higher Education: Evidence from Longitudinal and Repeated Cross-Sectional Data. 2004. Journal of Econometrics 121, no. 1-2: 175-212 and Oreopoulos, Philip, and Uros Petronijevic. 2013. Making College Worth It: A Review of Research on the Returns to Higher Education. Future of Children 3(1): 41–65. Two-year community and technical colleges serve students with many different educational and career goals, including students seeking training or certification for specific occupations, students in Associate degree programs, dual-enrolled high-school students, and students who intend to transfer credits toward a four-year degree. For reviews of the research on these and other pathways, see Belfield, Clive, and Thomas Bailey. 2017. The Labor Market Returns to Sub-Baccalaureate College: A Review. A CAPSEE Working Paper. Center for Analysis of Postsecondary Education and Employment; An, Brian P., and Jason L. Taylor. 2019. A Review of Empirical Studies on Dual Enrollment: Assessing Educational Outcomes. Higher Education: Handbook of Theory and Research: Volume 34: 99–151; Carruthers, Celeste K., and Christopher Jepsen. 2021. Vocational Education: An International Perspective. The Routledge Handbook of the Economics of Education: 343–380; Hartman, Catherine. 2023. A Review of Vertical and Horizontal Transfer Student Transitions and Experiences. Higher Education: Handbook of Theory and Research: Volume 38: 483–538; Soliz, Adela. 2023. Career and Technical Education at Community Colleges: A Review of the Literature." AERA Open 9: 23328584231186618.↩︎
-
Previous reviews include Card, David. 2001. Estimating the Return to Schooling: Progress on Some Persistent Econometric Problems. Econometrica 69(5): 1127–1160; Harmon, Colm, Hessel Oosterbeek, and Ian Walker. 2003. The Returns to Education: Microeconomics. Journal of Economic Surveys 17(2): 115–156; Barrow, Lisa, and Ofer Malamud. 2015. Is College a Worthwhile Investment?. Annu. Rev. Econ. 7(1): 519–555; and Oreopoulos and Petronijevic, 2013.↩︎
-
National Center for Education Statistics. 2023. Undergraduate Enrollment, Condition of Education. U.S. Department of Education, Institute of Education Sciences. Accessed July 8, 2025.↩︎
-
Glasmeier, Amy. Living Wage Calculator. Living Wage Calculator. Accessed April 30, 2025.↩︎
-
Ashworth, Jared, and Tyler Ransom. 2019. Has the College Wage Premium Continued to Rise? Evidence from Multiple US Surveys. Economics of Education Review 69: 149-154.↩︎
-
Federal Reserve Bank of New York. 2025. The Labor Market for Recent College Graduates. Accessed July 8, 2025.↩︎
-
Variations of this general approach include Carnevale, Anthony P., Stephen J. Rose, and Ban Cheah. 2013. The College Payoff: Education, Occupations, Lifetime earnings; Abel, Jaison R., and Richard Deitz. 2014. Do the Benefits of College Still Outweigh the Costs? Current issues in economics and finance 20(3); Webber, Douglas. 2018. Is College Worth It? Going Beyond Averages. Third Way 18; Carruthers, Celeste K., Donald J. Bruce, Lawrence M. Kessler, and Linnea Endersby. 2023. Tennessee’s Post-Pandemic Workforce: Implications for the Value of Going to College. Boyd Center for Business and Economic Research.; Abel, Jaison R., and Richard Deitz. 2025. Is College Still Worth It?. Federal Reserve Bank of New York Liberty Street Economics.↩︎
-
See Harmon, Oosterbeek, and Walker (2003) for a survey of much of the early literature on the returns to education.↩︎
-
Card, David. 1995. Using Geographic Variation in College Proximity to Estimate the Return to Schooling, in Aspects of Labour Market Behaviour: Essays in Honour of John Vanderkamp, ed. Louis N. Christofides, E. Kenneth Grant, and Robert Swidinsky. Toronto: University of Toronto Press: 201–222. Card (2001) and others showed that growing up near a college is strongly related to the likelihood that one goes to college, which motivates an instrumental variable research design. Subsequent research emphasized the importance of additional controls that account for local labor market conditions around colleges as well as the tendency of higher-ability individuals to grow up near colleges. More generally, those who go to college only because of proximity are likely not representative of all young adults, and likewise, the returns to college via proximity are likely different from the average returns to college. Cameron, Stephen V., and Christopher Taber. 2004. Estimation of Educational Borrowing Constraints Using Returns to Schooling. Journal of Political Economy 112(1): 132–182; Carneiro, Pedro, James J. Heckman, and Edward J. Vytlacil. 2011. Estimating Marginal Returns to Education. American Economic Review 101(6): 2754–2781.↩︎
-
Smith, Jonathan, Joshua Goodman, and Michael Hurwitz. 2025. The Economic Impact of Access to Public Four-Year Colleges. Journal of Human Resources; Canaan, Serena, and Pierre Mouganie. 2018. Returns to Education Quality for Low-Skilled Students: Evidence from a Discontinuity. Journal of Labor Economics 36(2): 395–436; Bleemer, Zachary. 2021. Top Percent Policies and the Return to Postsecondary Selectivity. Research & Occasional Paper Series: CSHE. 1.2021.” Center for Studies in Higher Education; Kozakowski, Whitney. 2023. Are Four-Year Public Colleges Engines for Economic Mobility? Evidence from Statewide Admissions Thresholds: 23–727.↩︎
-
Card (2001) and Oreopoulos and Petronijevik (2013) discuss most of the Table 1 studies in more detail. Citation details for studies listed in Table 1 are as follows: Kane, T. J., and C.E. Rouse. 1993. Labor Market Returns to Two-and Four-Year Colleges: Is a Credit a Credit and Do Degrees Matter? WP No. 4268, National Bureau of Economic Research; Card, 1995; Lemieux, Thomas, and David Card. 2001. Education, Earnings, and the "Canadian GI Bill". Canadian Journal of Economics/Revue Canadienne D’Economique 34(2): 313–344; Hoekstra, Mark. 2009. The Effect of Attending the Flagship State University on Earnings: A Discontinuity-Based Approach. The Review of Economics and Statistics 91(4): 717–724.; Angrist, Joshua D., and Stacey H. Chen. 2011. Schooling and the Vietnam-era GI Bill: Evidence from the Draft Lottery. American Economic Journal: Applied Economics 3(2): 96–118; Zimmerman, Seth D. 2014. The Returns to College Admission for Academically Marginal Students. Journal of Labor Economics 32(4): 711–754; Ost, Ben, Weixiang Pan, and Douglas Webber. 2018. The Returns to College Persistence for Marginal Students: Regression Discontinuity Evidence from University Dismissal Policies. Journal of Labor Economics 36(3): 779–805; Mountjoy, Jack. 2022. Community Colleges and Upward Mobility. American Economic Review 112(8): 2580–2630; Smith, Goodman, and Hurwitz, 2025.
-
For an accessible book-length treatment of the risk-reward tradeoff around higher education, see Akers, Beth. 2021. Making College Pay: An Economist Explains How to Make a Smart Bet on Higher Education. Crown Currency.↩︎
-
Autor, David, Arindrajit Dube, and Annie McGrew. 2023. The Unexpected Compression: Competition at Work in the Low Wage Labor Market. WP No. w31010. National Bureau of Economic Research.↩︎
-
methodology makes the very strong assumption that the dynamics of the current labor market will not change in the future. However, the use of the most recent data available means that the pandemic-era wage gains experienced by those with the lowest levels of education/earnings are factored in to these predictions.↩︎
-
Authors’ calculations based on the methodology described here: Webber, Douglas A. 2016. Are College Costs Worth It? How Ability, Major, and Debt Affect the Returns to Schooling. Economics of Education Review 53: 296–310.↩︎
-
The vast majority of the literature on the returns to education uses pre-tax income, which will mechanically overstate the premium from a college degree under a progressive income tax.↩︎
-
College Board. 2024. Trends in College Pricing 2024.↩︎
-
Hanson, Melanie. 2026. Student Loan Debt Statistics. EducationData.org. Accessed February 2, 2026.↩︎
-
Eika, Lasse, Magne Mogstad, and Basit Zafar. 2019. Educational Assortative Mating and Household Income Inequality. Journal of Political Economy 127.6: 2795–2835.↩︎
-
Moretti, 2004.↩︎
-
This is discussed, alongside many other aspects of the financial return to college, in this seminal article: Avery, Christopher, and Sarah Turner. 2012. Student Loans: Do College Students Borrow Too Much—or Not Enough? Journal of Economic Perspectives 26(1): 165–192.↩︎
-
See Webber, 2018.↩︎
-
Figure 3 statistics See Kirkeboen, Lars J., Edwin Leuven, and Magne Mogstad. 2016. Field of Study, Earnings, and Self-Selection. The Quarterly Journal of Economics 131.3: 1057-1111; Andrews, Rodney J., Scott A. Imberman, Michael F. Lovenheim, and Kevin Stange. 2024. The Returns to College Major Choice: Average and Distributional Effects, Career Trajectories, and Earnings Variability. Review of Economics and Statistics: 1–45.↩︎
-
Figure 3 statistics are weighted by the enrollment at each institution relative to the entire sector so that the area under each curve is the same for each sector.↩︎
-
A recent report which estimates return on investment at the school-by-program level can be found here: Cooper, Preston. 2025. Does College Pay Off? A Comprehensive Return on Investment Analysis. Foundation for Research on Equal Opportunity. Accessed July 11, 2025.↩︎
-
See Cottom, Tressie McMillan, and William A. Darity Jr, eds. 2017. For-Profit Universities: The Shifting Landscape of Marketized Higher Education. Palgrave MacMillan.↩︎
-
See Cellini, Stephanie Riegg, and Nicholas Turner. 2019. Gainfully Employed?: Assessing the Employment and Earnings of For-Profit College Students Using Administrative Data. Journal of Human Resources 54(2): 342–370; Darolia, Rajeev, Cory Koedel, Paco Martorell, Katie Wilson, and Francisco Perez‐Arce. 2015. Do Employers Prefer Workers Who Attend For‐Profit Colleges? Evidence from a Field Experiment. Journal of Policy Analysis and Management 34(4): 881–903.↩︎
-
For a detailed summary of the literature, see Cellini, Stephanie Riegg. 2021. For-Profit Colleges in The United States: Insights from Two Decades of Research. The Routledge Handbook of the Economics of Education: 512–523.↩︎
-
Recent research from Missouri provides a notable exception to this pattern, finding evidence of returns to enrollment in a for-profit certificate/Associate’s degree program, conditional on employment, that match or exceed returns to community college attendance. See Jepsen, Christopher, Peter Mueser, Kenneth Troske, and Kyung-Seong Jeon. 2025. The Benefits of Alternatives to Conventional College: Comparing the Labor-Market Returns to For-Profit Schools and Community Colleges. Journal of Human Resources; Jepsen, Christopher, Peter Mueser, Kenneth Troske, and Kyung-Seong Jeon. 2025. Estimates of Earnings Returns by Field of Study For-Profit Schools and Community Colleges. Economics of Education Review 107: 102675.↩︎
-
See Brewer, Dominic J., Eric R. Eide, and Ronald G. Ehrenberg. 1999. Does It Pay to Attend an Elite Private College? The Journal of Human Resources 34(1): 104–123; Black, Dan A., and Jeffrey A. Smith. 2004. How Robust is the Evidence on the Effects of College Quality? Evidence from Matching. Journal of Econometrics 121(1-2): 99–124.↩︎
-
Dale, Stacy Berg, and Alan B. Krueger. 2002. Estimating The Payoff to Attending a More Selective College: An Application of Selection on Observables and Unobservables. The Quarterly Journal of Economics 117(4): 1491–1527; Dale, Stacy B., and Alan B. Krueger. 2014. Estimating The Effects of College Characteristics over the Career Using Administrative Earnings Data. Journal of Human Resources 49(2): 323–358.↩︎
-
See Key finding #1 and the discussion around Table 1; in particular, Hoekstra, Mark. 2009. The Effect of Attending the Flagship State University on Earnings: A Discontinuity-Based Approach. The Review of Economics and Statistics 91(4): 717–724; Smith, Goodman, and Hurwitz, 2025.↩︎
-
Mountjoy, Jack, and Brent R. Hickman. 2021. The Returns to College (s): Relative Value-Added and Match Effects in Higher Education. No. w29276. National Bureau of Economic Research.↩︎
-
Smith, Goodman, and Hurwitz (2025).↩︎
-
See, for instance, Kirkeboen, Lars J., Edwin Leuven, and Magne Mogstad. 2016. Field of Study, Earnings, and Self-Selection. The Quarterly Journal of Economics 131(3): 1057–1111; Eide, Eric R., Michael J. Hilmer, and Mark H. Showalter. 2016. Is It Where You Go or What You Study? The Relative Influence of College Selectivity and College Major on Earnings. Contemporary Economic Policy 34(1): 37–46.↩︎
-
The corresponding figure at two-year schools is likely much lower, but due to data limitations, it is more difficult to construct measures of success at two-year institutions, often because it can be difficult to track students who transfer. For a detailed discussion of these issues, as well as efforts to improve success metrics for two-year institutions, see Kosakow, Jason, Laura Dawson Ullrich, and Jacob Walker. 2023. Results From the Survey of Community College Outcomes Extended Pilot. Federal Reserve Bank of Richmond.↩︎
-
Denning, Jeffrey T., Eric R. Eide, Kevin J. Mumford, Richard W. Patterson, and Merrill Warnick. 2022. Why Have College Completion Rates Increased? American Economic Journal: Applied Economics 14(3): 1–29.↩︎
-
Gaulke, Amanda P 2022. Returns to Bachelor’s Degree Completion Among Stopouts. Economics of Education Review 86: 102218.↩︎
-
Huntington-Klein, Nick. 2021. Human Capital Versus Signaling Is Empirically Unresolvable. Empirical Economics 60(5): 2499–2531.↩︎
-
Justicz, Timothy, Aaron Phipps, and Joseph Price. 2023. More Than Sheepskin: A Natural Experiment on College and Earnings. Available at SSRN 4524082.↩︎
-
See Flores-Lagunes, Alfonso, and Audrey Light. 2010. Interpreting Degree Effects in the Returns to Education. Journal of Human Resources 45(2): 439–467; Jaeger, David A., and Marianne E. Page.1996. Degrees Matter: New Evidence on Sheepskin Effects in the Returns to Education. The Review of Economics and Statistics: 733–740.↩︎
-
Dynarski, Susan. 2016. The Trouble with Student Loans? Low Earnings, Not High Debt. Brookings Note.↩︎
-
Lockwood, Jacob, and Douglas Webber. 2023. Non-completion, Student Debt, and Financial Well-Being: Evidence from the Survey of Household Economics and Decisionmaking.↩︎
-
See Houle, Jason N., and Fenaba R. Addo. 2019. Racial Disparities in Student Debt and the Reproduction of the Fragile Black Middle Class. Sociology of Race and Ethnicity 5(4): 562–577; Scott-Clayton, Judith, and Jing Li. 2016. Black-White Disparity in Student Loan Debt More Than Triples After Graduation.↩︎Webber, 2016.↩︎
-
Webber, 2016.↩︎
-
Carruthers, Celeste. 2024. How a Bachelor’s Degree Earnings Threshold Could Be Used for Graduate Program Accountability Postsecondary Equity and Economics Research Project.↩︎
-
Altonji, Joseph G., and Ling Zhong. "The labor market returns to advanced degrees." Journal of Labor Economics 39, no. 2 (2021): 303-360, and Altonji, Joseph, and Zhengren Zhu. Returns to specific graduate degrees: Estimates using Texas administrative records. No. w33530. National Bureau of Economic Research, 2025.↩︎
-
Darolia, Rajeev, Chuanyi Guo, and Youngran Kim. 2023. The Labor Market Returns to Very Short Postsecondary Certificates.↩︎
-
Cellini, Stephanie. 2018. Gainfully Employed? New Evidence on the Earnings, Employment and Debt of For-Profit Certificate Students. Policy Brief, Economic Studies, Brookings Institution; Cellini, Stephanie Riegg, and Nicholas Turner. 2019. Gainfully Employed?: Assessing the Employment and Earnings of For-Profit College Students Using Administrative Data. Journal of Human Resources 54(2): 342–370.↩︎
-
The rise in four-year college and university certificates has been concentrated in places with outcomes-based funding. Choi, Junghee. 2024. Performance-Based Funding and Certificates at Public Four-Year Institutions. Research in Higher Education 65(6): 1065–1084.↩︎Brynjolfsson, Erik, Bharat Chandar, and Ruyu Chen. 2025. Canaries in the Coal Mine?: Six Facts about the Recent Employment Effects of Artificial Intelligence..↩︎
-
Brynjolfsson, Erik, Bharat Chandar, and Ruyu Chen. 2025. Canaries in the Coal Mine?: Six Facts about the Recent Employment Effects of Artificial Intelligence..↩︎
-
Goldin, Claudia. 2003. The Human Capital Century. Education Next 3(1): 73–79.↩︎
Suggested Citation
Webber, Doug and Celeste K. Carruthers (2026). "Returns to Four-Year Higher Education," in Live Handbook of Education Policy Research, in Douglas Harris (ed.), Association for Education Finance and Policy, viewed 09/22/2026, https://livehandbook.org/higher-education/institutions-and-majors/returns-to-four-year-higher-education/.